`annotation_scalebar()` adds a projection-aware scale bar to a ggplot map. It reads the map's CRS (from `coord_sf()` or from the `crs` argument), chooses a readable width and units, and uses robust fallbacks so that the scale bar still draws even when CRS information is limited.
Supported styles: * `"segment"` – minimal horizontal bar with ticks and labels (default) * `"ticks"` – baseline with vertical ticks * `"bar"` – alternating black/white blocks
Usage
annotation_scalebar(
  mapping = NULL,
  data = NULL,
  ...,
  location = "bl",
  style = "segment",
  fixed_width = NULL,
  crs_unit = NULL,
  crs = NULL,
  display_unit = NULL,
  unit_labels = NULL,
  width_hint = 0.25,
  unit_category = "metric",
  bar_cols = c("black", "white"),
  line_width = 1,
  height = grid::unit(0.25, "cm"),
  pad_x = grid::unit(0.25, "cm"),
  pad_y = grid::unit(0.25, "cm"),
  text_pad = grid::unit(0.15, "cm"),
  text_cex = 0.7,
  text_face = NULL,
  text_family = "",
  tick_height = 0.6,
  segments = NULL,
  label_show = "ends",
  minor_tick_height = 0.5,
  geographic_mode = c("approx_m", "degrees"),
  text_col = "black",
  line_col = "black"
)
Arguments
- mapping, data
Standard ggplot2 layer arguments (typically unused).
- ...
Additional parameters passed to the layer (rarely needed).
- location
Character. One of `"bl"`, `"br"`, `"tr"`, `"tl"`; placement relative to panel edges. Default: `"bl"`.
- style
Character. Scale bar style: `"segment"` (default), `"bar"`, or `"ticks"`.
- fixed_width
Numeric. Bar width in *native CRS units* (for example, meters). Overrides automatic width selection.
- crs_unit
Character. CRS units (for example `"m"`, `"ft"`, `"°"`). Usually auto-detected; set only when auto-detection is not possible.
- crs
An [sf::st_crs] object or a PROJ string. Fallback CRS when the plot does not provide one (for example, when not using `coord_sf()`).
- display_unit
Character. Display units for labels (for example `"m"`, `"km"`). Ignored when `geographic_mode = "degrees"`.
- unit_labels
Named character vector for custom unit labels, e.g. `c(km = "Kilometers", m = "Meters", "°" = "°")`.
- width_hint
Numeric in (0, 1]. Target fraction of the panel width used by the bar. Default: `0.25`.
- unit_category
Character. `"metric"` (default) or `"imperial"`. Affects automatic promotion of units (m → km, ft → mi).
- bar_cols
Character vector of length two. Fill colours for `"bar"` style blocks. Default: `c("black", "white")`.
- line_width
Numeric. Line width for outlines and ticks. Default: `1`.
- height
[grid::unit]. Bar height. Default: `unit(0.25, "cm")`.
- pad_x, pad_y
[grid::unit]. Padding from panel edges. Default: `unit(0.25, "cm")`.
- text_pad
[grid::unit]. Gap between the bar and text labels. Default: `unit(0.15, "cm")`.
- text_cex, text_face, text_family
Font settings for labels. Defaults: `0.7`, `NULL`, `""`.
- tick_height
Numeric in [0, 1]. Relative height of interior ticks for `"ticks"` style. Default: `0.6`.
- segments
Integer. For `"segment"` style, number of major divisions. If `NULL`, an automatic, readable choice is used.
- label_show
Which ticks get labels: `"ends"` (default), `"all"`, `"major"`, a numeric frequency (for example `2`), or a numeric vector of 1-based indices.
- minor_tick_height
Numeric in [0, 1]. For `"segment"` style, relative height of minor ticks. Default: `0`.
- geographic_mode
Character, for **geographic CRS** only: * `"approx_m"`: approximate meters/kilometers (default; warns about approximation). * `"degrees"`: show raw degrees (no metric conversion).
- text_col, line_col
Colours for text labels and outlines/ticks. Defaults: `"black"`, `"black"`.
Details
* With a **projected CRS** (for example UTM or AEQD in meters), the scale bar is measured in native map units and is as accurate as the projection. * With a **geographic CRS** (EPSG:4326, degrees), distance depends on latitude. The `geographic_mode` argument controls how degrees are handled: - `"approx_m"` (default): approximate meters/kilometers using a great-circle distance at the panel’s mid-latitude (a warning is issued). - `"degrees"`: display raw degree units (for example `1°`) without converting. * You can override the automatically chosen width with `fixed_width`, which is interpreted in native CRS units.
Examples
nc <- sf::st_read(system.file("shape/nc.shp", package = "sf"), quiet = TRUE)
base_plot <- ggplot() +
geom_sf(data = nc, fill = "grey90") +
theme_minimal()
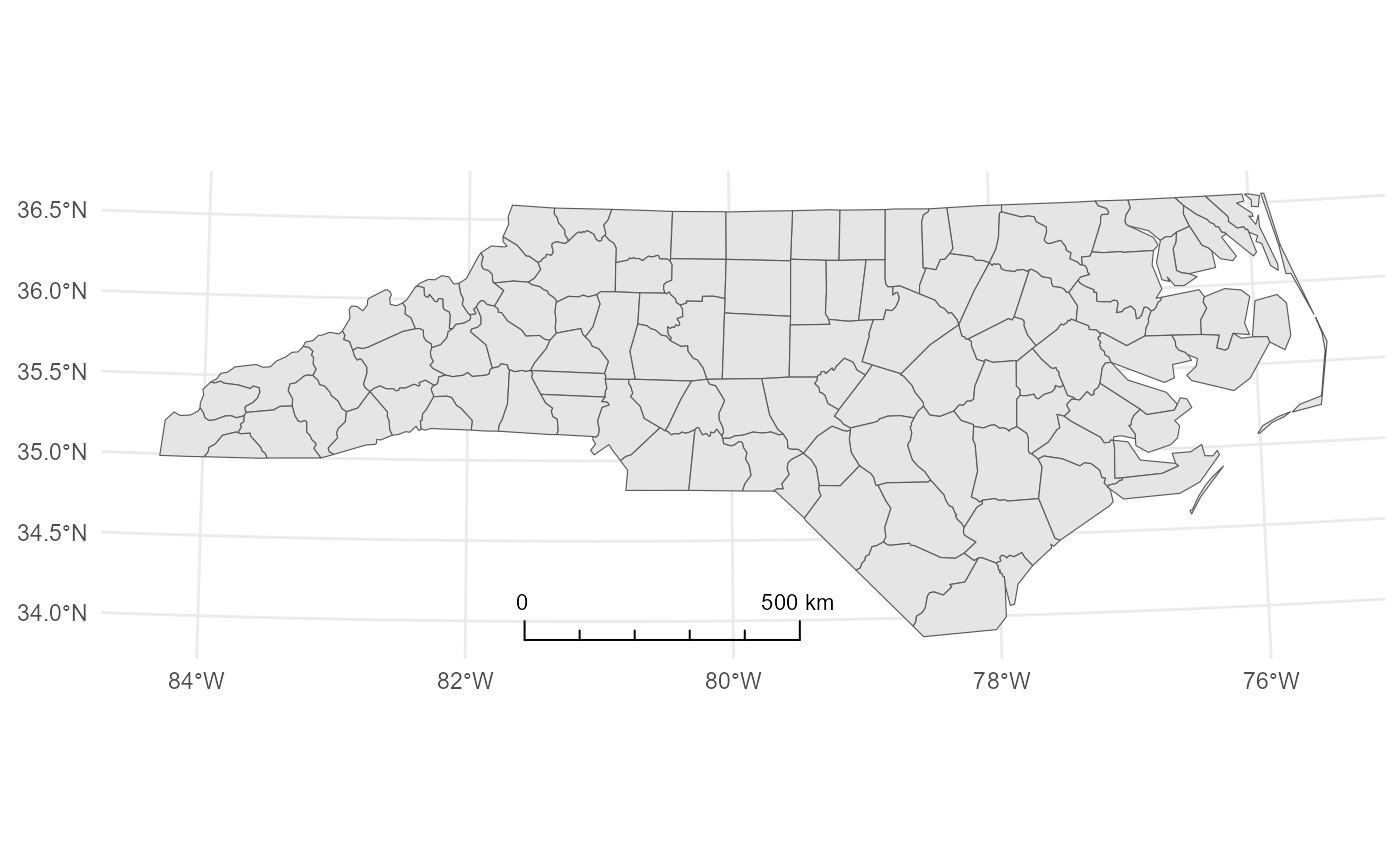
# Example 1: Projected CRS with a longer scale bar
base_plot +
coord_sf(crs = 32617) +
annotation_scalebar(location = "bl", width_hint = 0.5)
 # Example 2: Ticks style, top-right
base_plot +
coord_sf(crs = 32617) +
annotation_scalebar(location = "tr", style = "ticks")
# Example 2: Ticks style, top-right
base_plot +
coord_sf(crs = 32617) +
annotation_scalebar(location = "tr", style = "ticks")
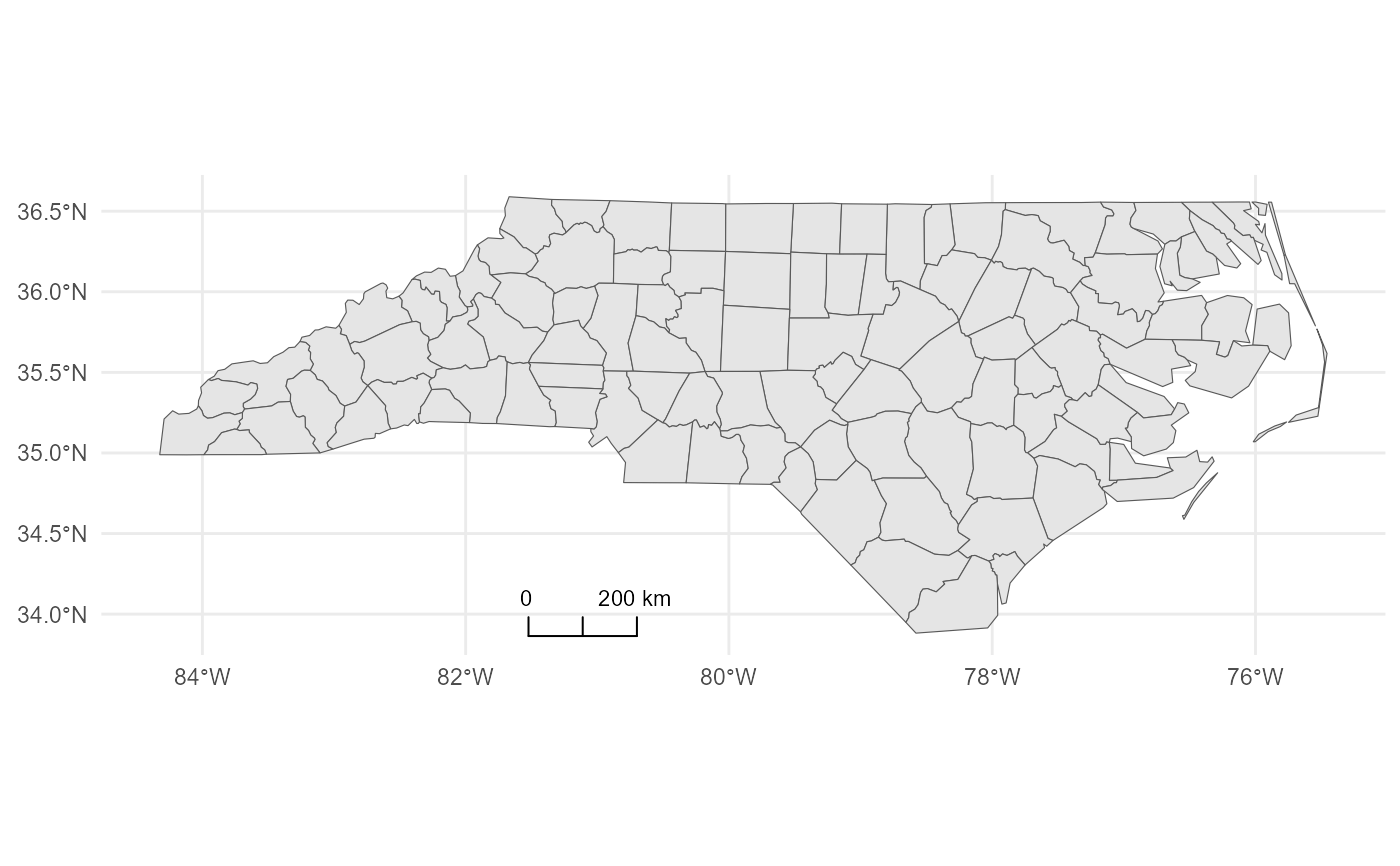
 # Example 3: Geographic CRS (EPSG:4326), approximate meters (warns)
base_plot +
coord_sf(crs = 4326) +
annotation_scalebar(location = "bl", geographic_mode = "approx_m")
#> Warning: Scale bar is approximate in geographic CRS (degrees). Distances vary with latitude. For accuracy, use a projected CRS, or set `geographic_mode = "degrees"`.
# Example 3: Geographic CRS (EPSG:4326), approximate meters (warns)
base_plot +
coord_sf(crs = 4326) +
annotation_scalebar(location = "bl", geographic_mode = "approx_m")
#> Warning: Scale bar is approximate in geographic CRS (degrees). Distances vary with latitude. For accuracy, use a projected CRS, or set `geographic_mode = "degrees"`.
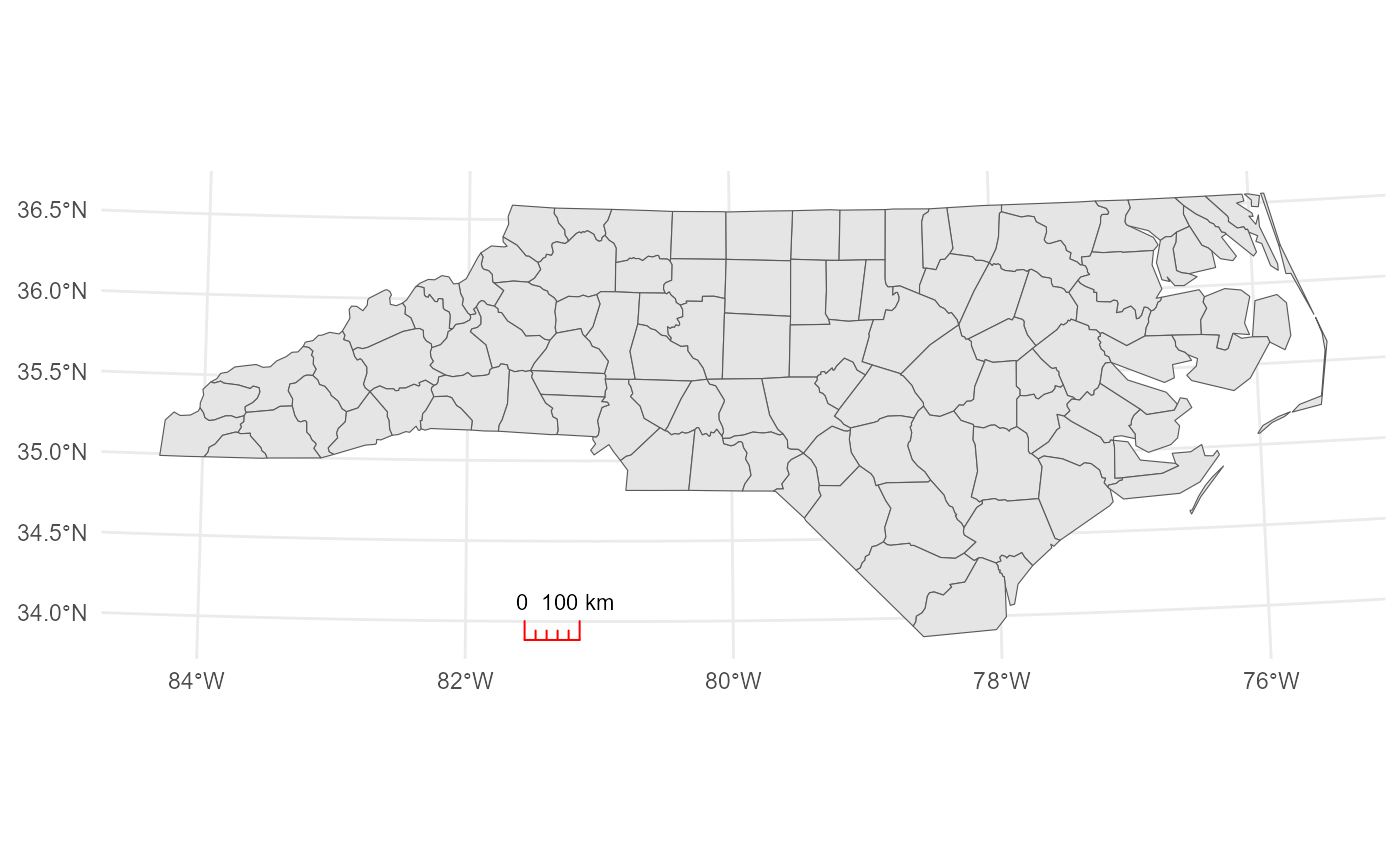
 # Example 4: Force a 100 km bar with red outlines
base_plot +
coord_sf(crs = 32617) +
annotation_scalebar(
location = "bl",
fixed_width = 100000,
display_unit = "km",
line_col = "red"
)
# Example 4: Force a 100 km bar with red outlines
base_plot +
coord_sf(crs = 32617) +
annotation_scalebar(
location = "bl",
fixed_width = 100000,
display_unit = "km",
line_col = "red"
)