Creates a ggplot2 layer for displaying buffered areas around China's boundaries, including both the mainland boundary and the ten-segment line. Buffers with user-defined distances are generated around each boundary, providing flexibility in projection and appearance.
Usage
geom_buffer_cn(
  mainland_dist = 20000,
  ten_line_dist = NULL,
  crs = "+proj=aeqd +lat_0=35 +lon_0=105 +ellps=WGS84 +units=m +no_defs",
  color = NA,
  fill = "#D2D5EB",
  ...
)
Arguments
- mainland_dist
Numeric. The buffer distance (in meters) for the mainland boundary.
- ten_line_dist
Numeric. The buffer distance (in meters) for each segment of the ten-segment line. If not specified, it defaults to the same value as `mainland_dist`.
- crs
Character. The coordinate reference system (CRS) for the projection. Defaults to "+proj=aeqd +lat_0=35 +lon_0=105 +ellps=WGS84 +units=m +no_defs". Users can specify other CRS strings (e.g., "+proj=merc" for Mercator).
- color
Character. The border color for the buffer area. Default is `NA` (transparent).
- fill
Character. The fill color for the buffer area. Default is `"#D2D5EB"`.
- ...
Additional parameters passed to `geom_sf`.
Value
A ggplot2 layer displaying buffered areas around China's boundaries, with customizable buffer distances for the mainland boundary and the ten-segment line, using the specified projection.
Examples
# \donttest{
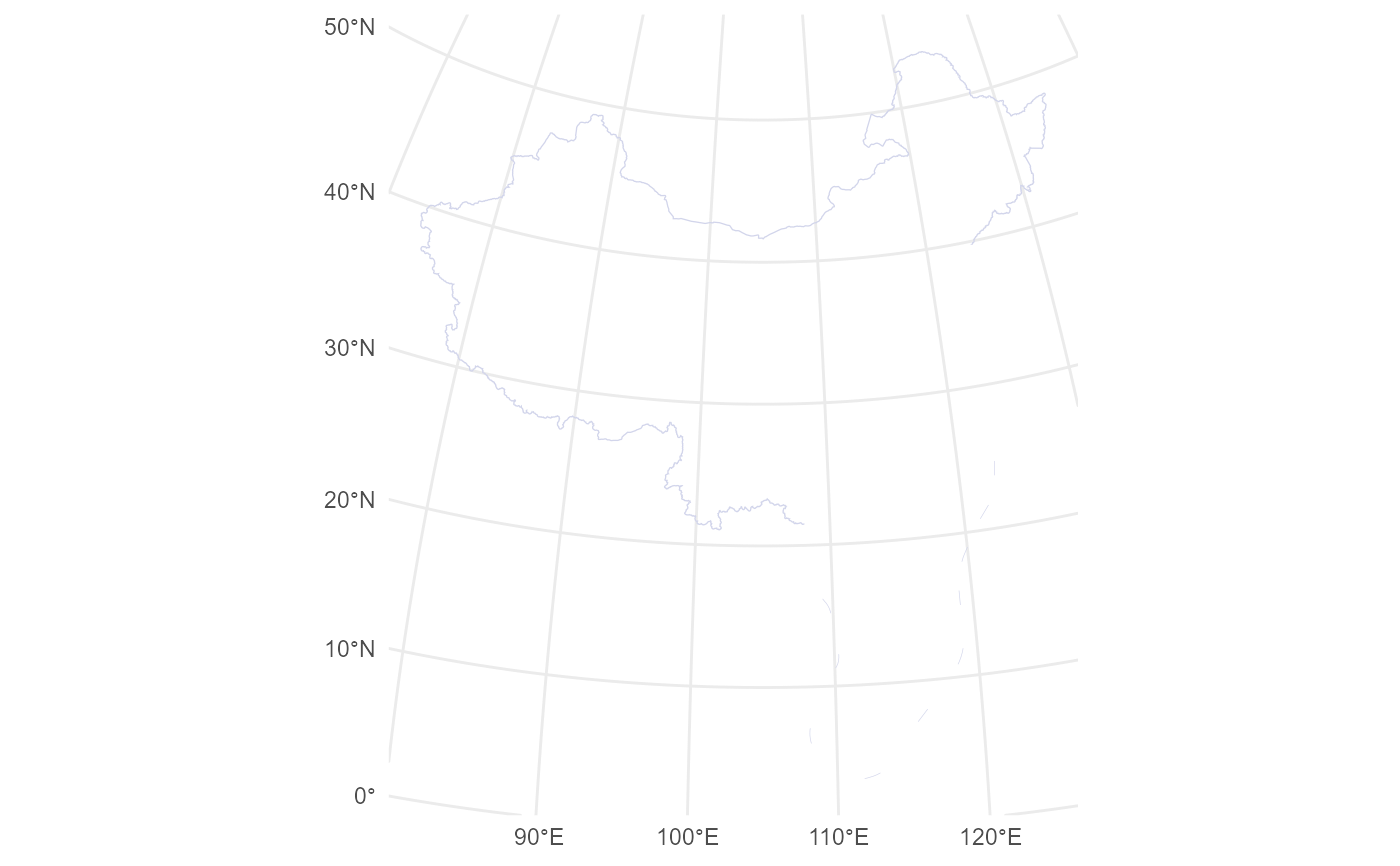
# Plot buffers with specified distances for mainland and ten-segment line
ggplot() +
geom_buffer_cn(
mainland_dist = 10000,
ten_line_dist = 5000
) +
theme_minimal()
#> Warning: attribute variables are assumed to be spatially constant throughout all geometries
 # }
# }